At the start of this decade, Manchester United were Premier League champions, Portsmouth were in the top flight, Frank Lampard was a Chelsea player and the record transfer fee paid by a British club was £32.5m.
A lot has happened since.
The Premier League trophy is still held by a Manchester club - but it is in the hands of City, who have averaged a piece of silverware a year since 2010. Portsmouth are in League One, following three relegations and a promotion. Lampard is now Blues manager. And Paul Pogba's move to Manchester United has added more than £50m to the record transfer fee that was set by Robinho's switch to Etihad Stadium.
A total of 3,774 games have been played, 10,382 points earned, 10,323 goals scored and more than £10bn spent by top-flight clubs on players in pursuit of largely unrealised glory.
As the 2010s draw to a close, BBC Sport casts an eye back to identify the key names and numbers and paint a statistical picture of the past 10 years of the Premier League.
Man City rise to prominence
| Who won what in England? |
| |
Premier League |
FA Cup |
League Cup |
| 2009-10 |
Chelsea |
Chelsea |
Manchester United |
| 2010-11 |
Manchester United |
Manchester City |
Birmingham City |
| 2011-12 |
Manchester City |
Chelsea |
Liverpool |
| 2012-13 |
Manchester United |
Wigan Athletic |
Swansea City |
| 2013-14 |
Manchester City |
Arsenal |
Manchester City |
| 2014-15 |
Chelsea |
Arsenal |
Chelsea |
| 2015-16 |
Leicester City |
Manchester United |
Manchester City |
| 2016-17 |
Chelsea |
Arsenal |
Manchester United |
| 2017-18 |
Manchester City |
Chelsea |
Manchester City |
| 2018-19 |
Manchester City |
Manchester City |
Manchester City |
It has been increasingly Manchester City's decade on the pitch.
The Blues entered the decade having not won the top-flight title since 1968 and without a major trophy since 1970, but with significantly enhanced prospects following the 2008 takeover of the club by the mega-rich Abu Dhabi United Group.
They lifted the FA Cup in the first full season of the 2010s and have rarely looked back, winning the first of their four Premier League titles in 2012 under Roberto Mancini, the second under Manuel Pellegrini in 2014 and also in the past two seasons with Pep Guardiola in charge.
Of the past six major domestic trophies on offer - Premier League, FA Cup and Carabao Cup - City have claimed five of them, only failing to win the 2018 FA Cup.
However, while they will end the decade as champions, they will not end it on top of the table, with leaders Liverpool 14 points clear of them - and 10 above second-placed Leicester City - with two games to play.
The main rivals to City's 2010s success are Chelsea, who won the double in the first year of the decade and added five more trophies over the next nine.
Other teams had significant moments - Sir Alex Ferguson would close his glittering Manchester United reign with two more Premier League crowns in 2011 and 2013, while Leicester shocked everyone to achieve arguably the most remarkable league triumph of them all in 2015-16.
The Foxes were one of only four sides other than Arsenal, Chelsea, Liverpool, Manchester City and Manchester United to win a major domestic trophy during the 2010s. Wigan, Birmingham and Swansea were the others, and all of them suffered for their temerity with relegation to the Championship.
There was also success in Europe for English clubs - Chelsea (2012) and Liverpool (2019) won the Champions League, while the Blues (2013 and 2019) and Manchester United (2017) won the Europa League.
Manchester City's dominance is reflected in the overall Premier League table of the 2010s. They sit top, are the only side to have earned more than two points per game and have an unmatched win percentage of 65.87%.
Their 3-0 win at Arsenal on Sunday took their goal difference to 500, with 838 goals scored - 127 more than nearest rivals Chelsea.
| Overall Premier League table of the decade |
| |
P |
W |
D |
L |
GD |
Pts |
PPG |
| Manchester City |
378 |
249 |
65 |
64 |
500 |
812 |
2.148 |
| Manchester United |
377 |
218 |
87 |
72 |
313 |
741 |
1.966 |
| Chelsea |
377 |
218 |
80 |
79 |
331 |
734 |
1.947 |
| Liverpool |
377 |
204 |
92 |
81 |
309 |
704 |
1.867 |
| Tottenham |
377 |
205 |
84 |
88 |
115 |
699 |
1.854 |
| Arsenal |
378 |
205 |
85 |
88 |
267 |
700 |
1.852 |
| Everton |
378 |
149 |
113 |
116 |
70 |
560 |
1.481 |
| Sheffield United |
17 |
6 |
7 |
4 |
5 |
25 |
1.471 |
| Leicester City |
207 |
85 |
49 |
73 |
36 |
304 |
1.469 |
| Southampton |
283 |
92 |
80 |
111 |
-28 |
356 |
1.258 |
| Stoke City |
323 |
99 |
94 |
130 |
-102 |
391 |
1.211 |
| Newcastle |
321 |
105 |
73 |
143 |
-100 |
388 |
1.209 |
| Crystal Palace |
245 |
80 |
52 |
113 |
-60 |
292 |
1.192 |
| West Ham |
339 |
104 |
91 |
144 |
-99 |
403 |
1.189 |
| Swansea |
266 |
82 |
66 |
118 |
-77 |
312 |
1.173 |
| Bournemouth |
169 |
52 |
40 |
77 |
-69 |
196 |
1.160 |
| West Brom |
304 |
85 |
87 |
132 |
-90 |
342 |
1.125 |
| Wolves |
149 |
41 |
42 |
66 |
-63 |
165 |
1.107 |
| Blackburn Rovers |
94 |
27 |
22 |
45 |
-42 |
103 |
1.096 |
| Bolton Wanderers |
96 |
28 |
19 |
49 |
-50 |
103 |
1.073 |
| Watford |
169 |
48 |
37 |
84 |
-84 |
181 |
1.071 |
| Burnley |
187 |
52 |
42 |
93 |
-96 |
198 |
1.059 |
| Fulham |
209 |
57 |
50 |
102 |
-111 |
221 |
1.057 |
| Wigan Athletic |
133 |
33 |
39 |
61 |
-85 |
138 |
1.038 |
| Brighton |
93 |
23 |
27 |
43 |
-49 |
96 |
1.032 |
| Blackpool |
38 |
10 |
9 |
19 |
-23 |
39 |
1.026 |
| Sunderland |
284 |
69 |
84 |
131 |
-125 |
291 |
1.025 |
| Birmingham City |
56 |
12 |
21 |
23 |
-32 |
57 |
1.018 |
| Norwich City |
169 |
42 |
44 |
83 |
-109 |
170 |
1.006 |
| Aston Villa |
263 |
63 |
75 |
125 |
-151 |
264 |
1.004 |
| Hull City |
132 |
29 |
31 |
72 |
-95 |
118 |
0.894 |
| Cardiff City |
76 |
17 |
13 |
46 |
-69 |
64 |
0.842 |
| QPR |
114 |
22 |
26 |
66 |
-84 |
92 |
0.807 |
| Portsmouth |
18 |
3 |
5 |
10 |
-18 |
14 |
0.788 |
| Middlesbrough |
38 |
5 |
13 |
20 |
-26 |
28 |
0.737 |
| Reading |
38 |
6 |
10 |
22 |
-30 |
28 |
0.737 |
| Huddersfield Town |
76 |
12 |
17 |
47 |
-84 |
53 |
0.697 |
There are few surprises at the bottom, where Huddersfield - one of seven sides clocking in with less than a point per game - prop up the rest. The Terriers' disastrous second season in the top flight largely undermined all the good they did in their first.
Just above them are two sides that lasted just a season each - Middlesbrough and Reading - and Portsmouth, whose relegation at the end of the 2009-10 season was just a taste of the further pain to come for them.
Six into four won't go
The decade began with a 'big four' - Arsenal, Chelsea, Liverpool and Manchester United - but it ends with a 'big six', with Manchester City and Tottenham pulling up a chair to sit at the top table.
The status of this group is borne out in the overall table, with a sizeable gap in points earned per game between them and Everton in seventh, while they are the only teams with a goal difference in credit to the tune of three figures across the decade.
Interestingly, and perhaps a sign of the growing disparity in England's top division, only Everton, Leicester and Sheffield United join the top six in having a positive goal difference - although the Blades have only played 17 games.
The fact only one club can win the title, and four qualify for the Champions League, has led to some almighty jockeying for position amongst the country's premier six sides over the past 10 years.
And there are a few notable strands to pick at.
City's points-per-game rise over the decade is almost the inverse of Manchester rivals United's fall, with the latter steadily dropping from an end-of-Ferguson-era high and the former building to a Guardiola-inspired peak.
There has been a huge tussle for superiority in north London. In the first seven final tables of the decade, Arsenal finished above Tottenham - and by only one place in the first four.
But the past three seasons have seen a Spurs resurgence, culminating in them sneaking ahead of the Gunners by just 0.002 points per game over the entire 10 years.
Current Premier League leaders Liverpool's running points-per-game total dropped as low as 1.489 at the end of 2011-12, before Sir Kenny Dalglish made way for Brendan Rodgers as manager.
Under Rodgers, and especially his successor, Jurgen Klopp, the Reds' points-per-game tally has improved significantly to 1.867. And their stunning form over the first 16 matches of this season has seen them claim a place in the top four with just a few games of the decade to go.
Pep talk
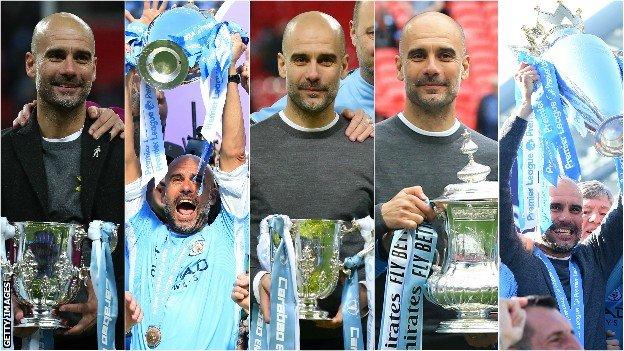
Pep Guardiola has won five major trophies during his time in England - and he really likes that grey jumper
With Manchester City the most successful side of the decade, it is no surprise to find one of their chief architects topping the manager charts.
Guardiola, winner of 20 major trophies in his career - including five in England - can add an extra (albeit minor) feather to his cap, courtesy of an unrivalled top-flight win percentage of 74.62% and points per-game haul of 2.374.
Few other bosses come close, with Ferguson's 69.70% win percentage and 2.273 points per game the next best.
Klopp is fourth on the list, but is likely to move ahead of former Chelsea manager Antonio Conte given their points-per-game records are separated by only 0.002 points and with the Reds in such a rich vein of form.
Arsene Wenger managed in the most games during the 2010s (323 for Arsenal) and claimed the most points (608), but his record leaves him eighth in the overall points-per-game list of those to have been in charged for at least a season's worth of matches, behind the aforementioned managers and a trio of title-winning bosses - Mancini, Carlo Ancelotti and Jose Mourinho.
The bottom of the complete list is populated with a host of managers who failed to clock up a season's worth of games, including infamous figures such as Pepe Mel, who took just 15 points from his 17 games as West Brom boss, Remi Garde, who managed just 12 points from 20 games at Villa, and poor Jan Siewert, who amassed only five points from his 15 games at Huddersfield.
However, Siewert is spared being bottom of the pile by Frank de Boer, who did not win a single point at Palace before his four-game stint as boss was ended.
Of the managers to have taken charge of at least a season's worth of games, Avram Grant (with Portsmouth and West Ham) has the dishonour of possessing the worst win percentage this decade (just 18.18%), which is ever so slightly worse than another Huddersfield boss, David Wagner (18.33%), and Alex McLeish (19.64% from his stints at midlands rivals Birmingham and Aston Villa).
Grant did earn marginally more points per game than Wagner, though - 0.855 to 0.8 - with Neil Warnock (QPR and Cardiff) completing the bottom three on 0.892.
Jordan, James and Jamie
Jordan Henderson has been unduly maligned at various junctures in his career, but he must be doing something right because he has played more Premier League games than any other player in the 2010s - 306 of them for Sunderland and then Liverpool.
There is only a game in it, though, with Henderson's Reds team-mate and former Aston Villa and Manchester City midfielder James Milner clocking up 305 games, during which he has probably played in every position except goalkeeper.
Unsurprisingly, four keepers do make the top 10 - Ben Foster, David de Gea, Petr Cech and Joe Hart (who is level with left-back Leighton Baines on 271) - with only one man on the list, Manchester City midfielder David Silva, what you might describe as an attacking player.

Most Premier League appearances between 2010 and 2020 - data supplied by Opta
Foster's 303 games have included a decade-high 983 saves, Cech has kept the most clean sheets - 107 in his 274 matches - while Silva has far and away the most assists (89 - 27 more than next-best Christian Eriksen) and chances created (his 768 completely eclipsing the 595 fashioned by second-placed Eden Hazard).
The leading goalscorer chart for the decade presents few surprises - with Manchester City's Sergio Aguero out front, followed by Tottenham's Harry Kane. Wayne Rooney and Romelu Lukaku are the other two with over 100 top-flight goals in the 2010s.
Of all the players on this list, Jamie Vardy has perhaps the most interesting personal narrative.
He began the decade playing for Stocksbridge Park Steels in the Northern Premier League - the seventh tier of English football - but will almost certainly end it as the leading goalscorer in the top flight this season, and having earned 26 England caps and a Premier League winners' medal.
He will also emerge from the 2010s with the strongest statistical claim to being the most lethal striker in England, possessing an unmatched top-flight conversion rate of 23.3%.
Vardy's nearest rivals, and the only two other players to have 50 goals to their name and a conversion rate above 20%? Aguero? Nope. Kane? Nah. Take a bow... Javier Hernandez and Diego Costa.
How much?!
As the amount of television revenue spent on Premier League rights has dramatically risen, so has the spending by top-flight clubs.
The three-year domestic and foreign broadcasting deals struck in 2010 were worth an estimated £3.2bn. The most recent deals, which started in August 2019 and will end in 2022, are expected to break the £9bn barrier.
It is no wonder then that clubs have ploughed this money into players they hope will keep them where the money is at, often unsuccessfully. For every Virgil van Dijk there is an Andy Carroll.
For the sake of comparison, the combined transfer windows (both before and during the season) for 2009-10 saw £480m spent by clubs, according to data supplied by Deloitte's Sports Business Group. Ten seasons on, the summer window alone comprised over £1.4bn worth of deals.
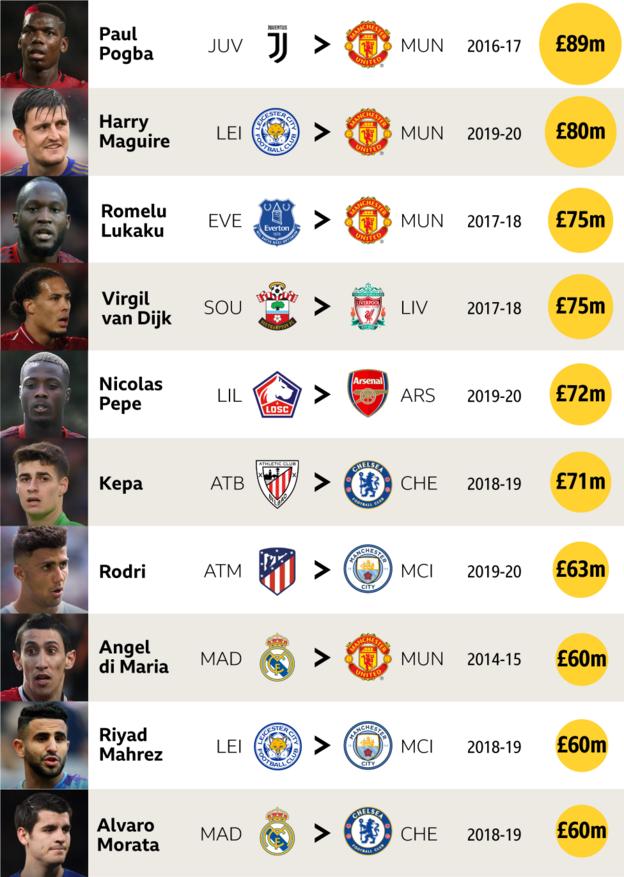
As previously mentioned, Robinho's £32.5m move to Manchester City was the record incoming transfer in English football history at the start of the decade.
The first £50m move came when Fernando Torres left Liverpool to join Chelsea in January 2011. This fee was surpassed in August 2014 when Manchester United paid Real Madrid £59.7m for forward Angel di Maria.
United topped the lot in August 2016, though, when they spent a then world record fee of £89m to bring midfielder Paul Pogba back to the club from Juventus.
Assisted by ever-increasing revenues, which this year hit a new high of £627m, United are responsible for the three biggest incoming transfers in English football history, with the purchase of Pogba ahead of last summer's £80m deal for defender Harry Maguire and the July 2017 £75m signing of striker Lukaku.
On the first day of the 2020s, a new transfer window opens and teams will start spending huge amounts of cash again in pursuit of more goals, more points and more trophies.
To quote one of the most infamous phrases of the Premier League in the 2010s: we go again.
 info@businessghana.com


